Research
Global biodiversity modelling
My main area of interest is in global biodiversity modelling, particularly animal pollinator response to anthropogenic activity. As part my PhD I combined two datasets to model the global response of local-scale pollinator biodiversity to land-use intensity: 1) the PREDICTS database of global biodiversity records (Hudson et al 2017); and 2) a new dataset of likely pollinating species, compiled through a combination of name-entity recognition algorithms and expert consultation (Millard et al 2021b).
Our work shows that low levels of intensity can benefit pollinators, but on anthropogenic land increasing intensity tends to decrease richness and abundance. Our research also shows that pollinator response to land-use intensity differs markedly among taxonomics groups and geographical zone, with a strongly positive response to increasing fertiliser application rate for flies, and a much stronger response to intensity in tropical relative to non-tropical cropland.
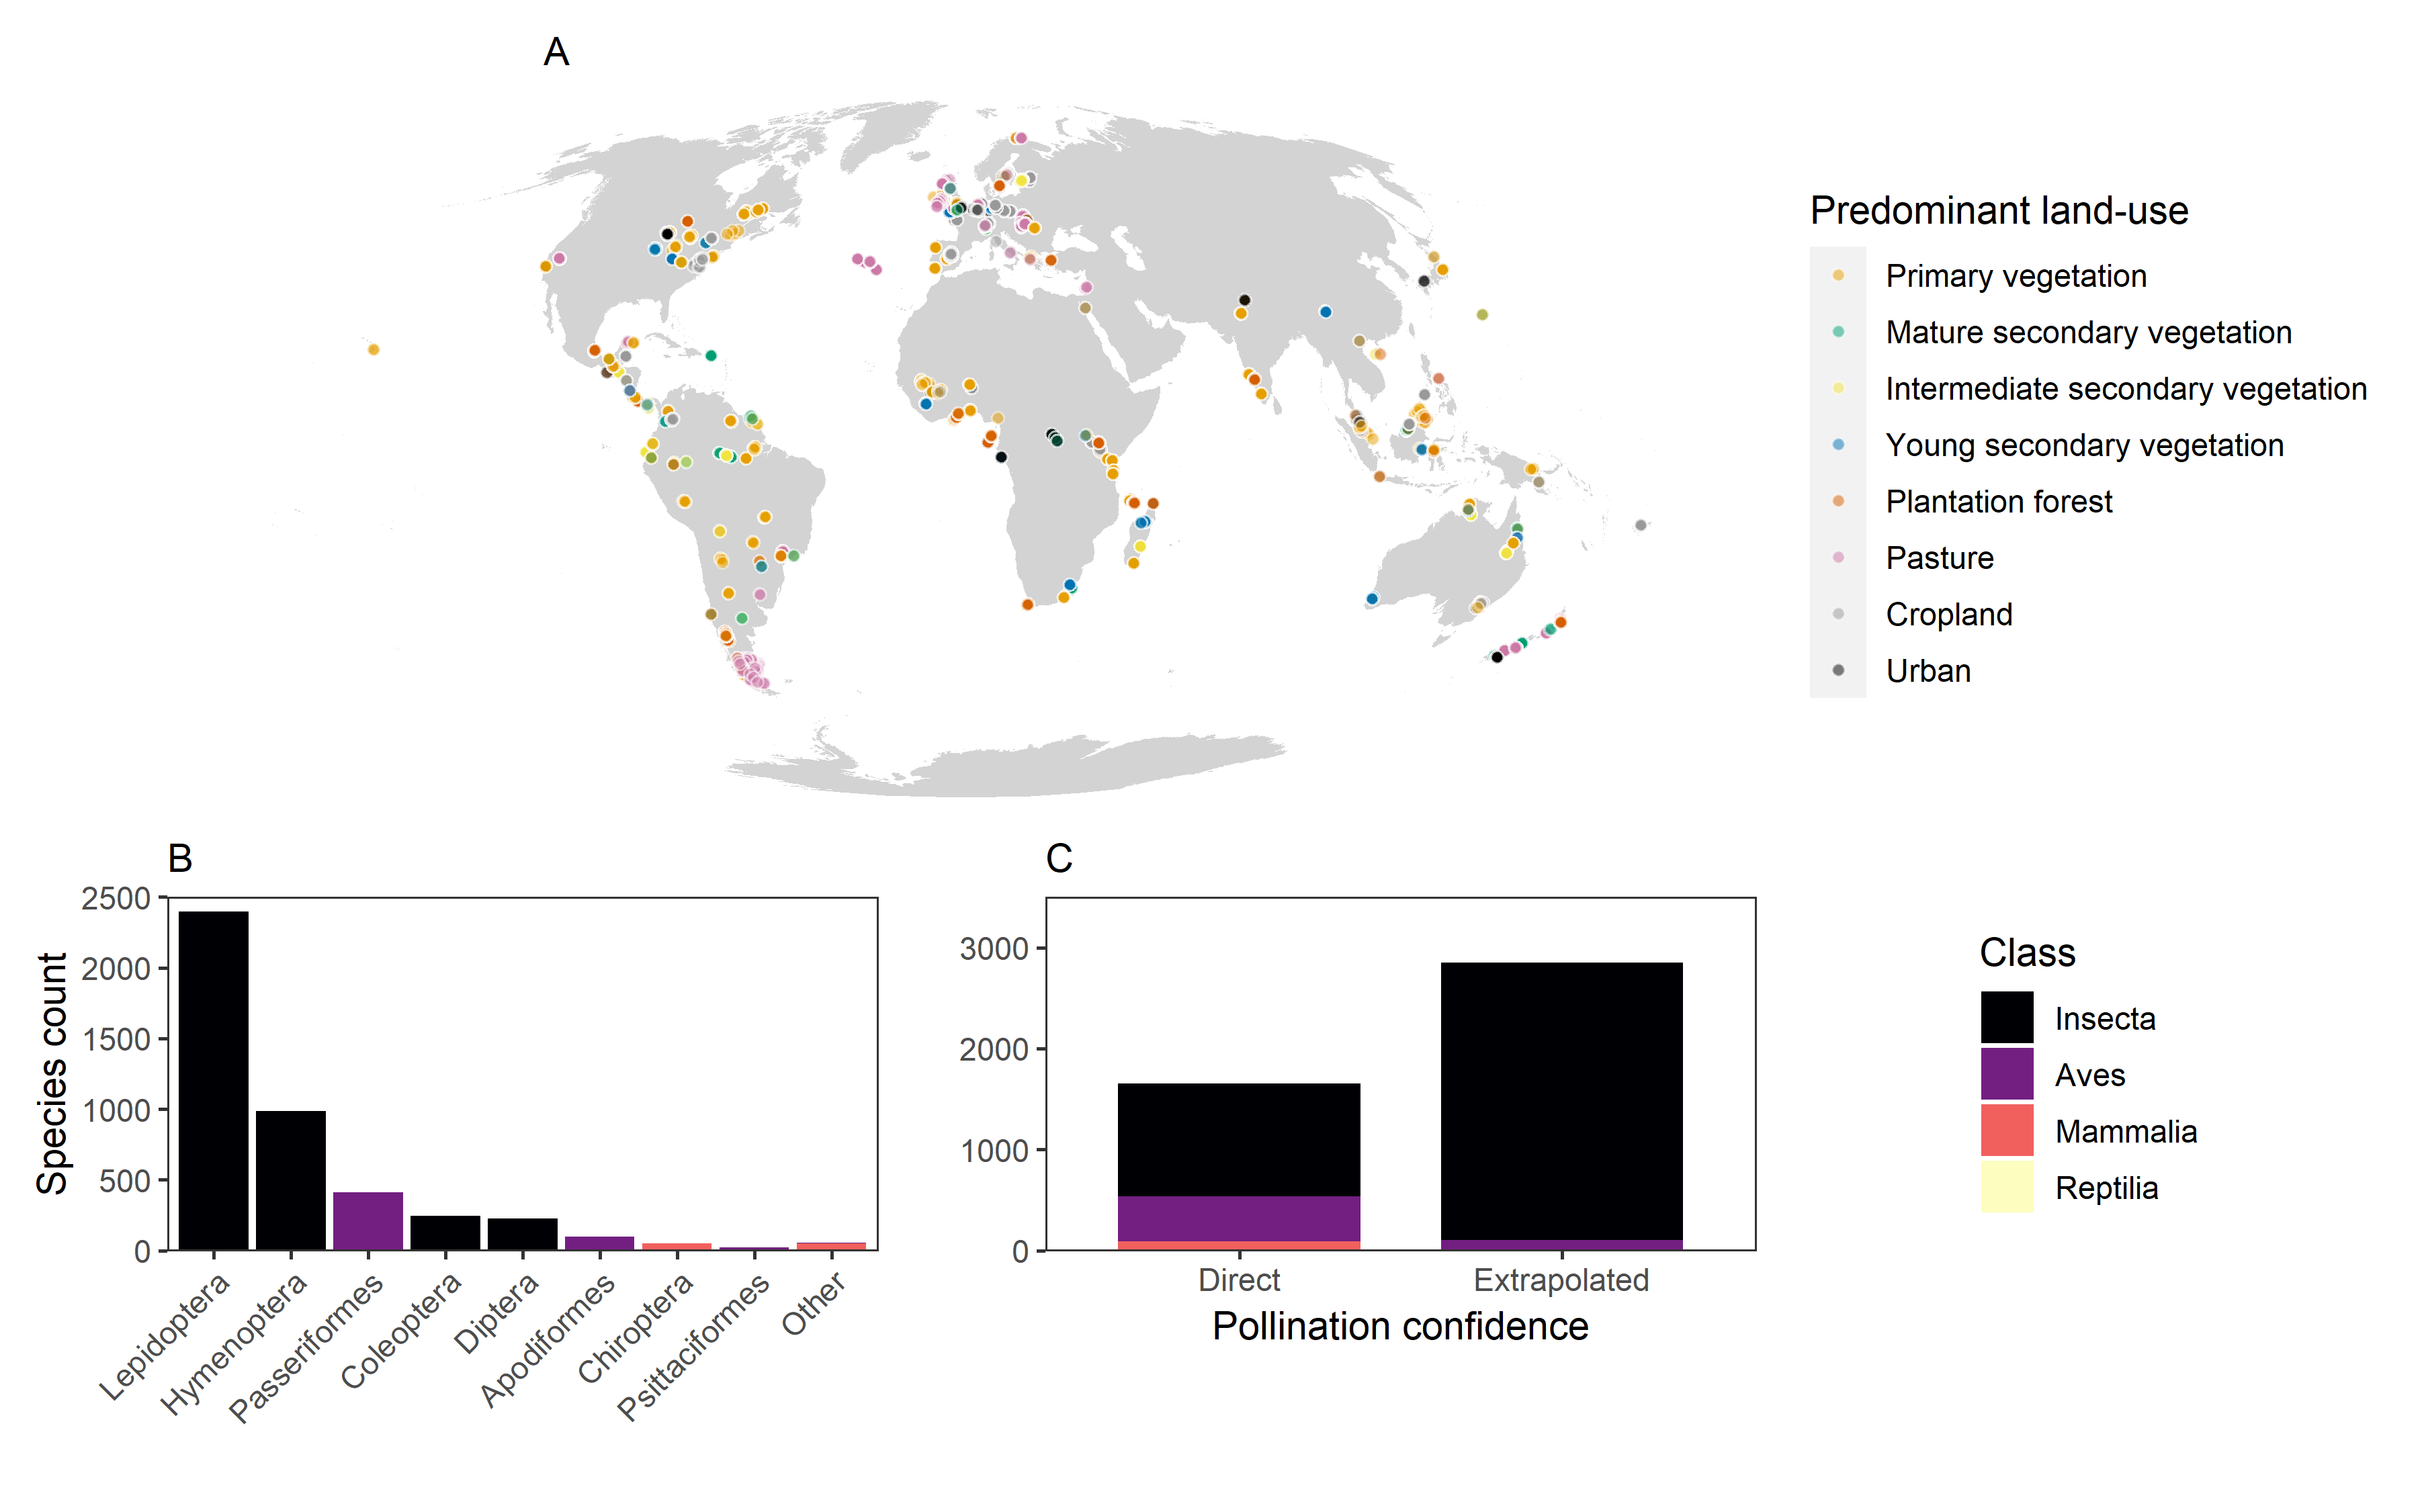
A) The global distribution of PREDICTS sites containing likely pollinating species, for which both the land-use type and intensity of that site are known (no. sites = 8639). Colours represent land-use type: orange (primary vegetation), green (mature secondary vegetation), yellow (intermediate secondary vegetation), blue (young secondary vegetation), dark orange (plantation forest), pink (pasture), grey (cropland), and black (urban). B) The taxonomic distribution of likely pollinating species in PREDICTS for all sites (no. species = 4502). The number of species indicated here will be an underestimate of the number of pollinating species in PREDICTS, since this figure only includes records for which there is a full scientific binomial in the database. Some biodiversity records in the PREDICTS database are recorded above the level of species. C) The source of information (direct evidence at the genus level or extrapolated to groups based on information for groups at higher taxonomic levels) for pollinators in PREDICTS, broken down by taxonomic class. In both B and C, there are four taxonomic classes: Insecta (black), Aves (purple), Mammalia (red), and Reptilia (yellow) (reproduced from Millard et al. 2021b)
In 2023 I published a paper showing that declines in insect pollinators from the interaction of climate change and land use are likely to be greatest in the tropics, potentially putting at risk the production of crops such as coffee and cocoa (Millard et al 2023). Importantly, we show that although proportional risk is highly subject to the assumed relationship between pollinator biodiversity and production, temperate regions are consistently projected at low risk, whereas tropical regions such as Southeast Asia are consistently projected at high risk. We also show how the distribution of risk to importers is such that import risk per capita is greater in the global north than the global south, and that crop pollination risk will likely experience volatility according to Southern Oscillation events.
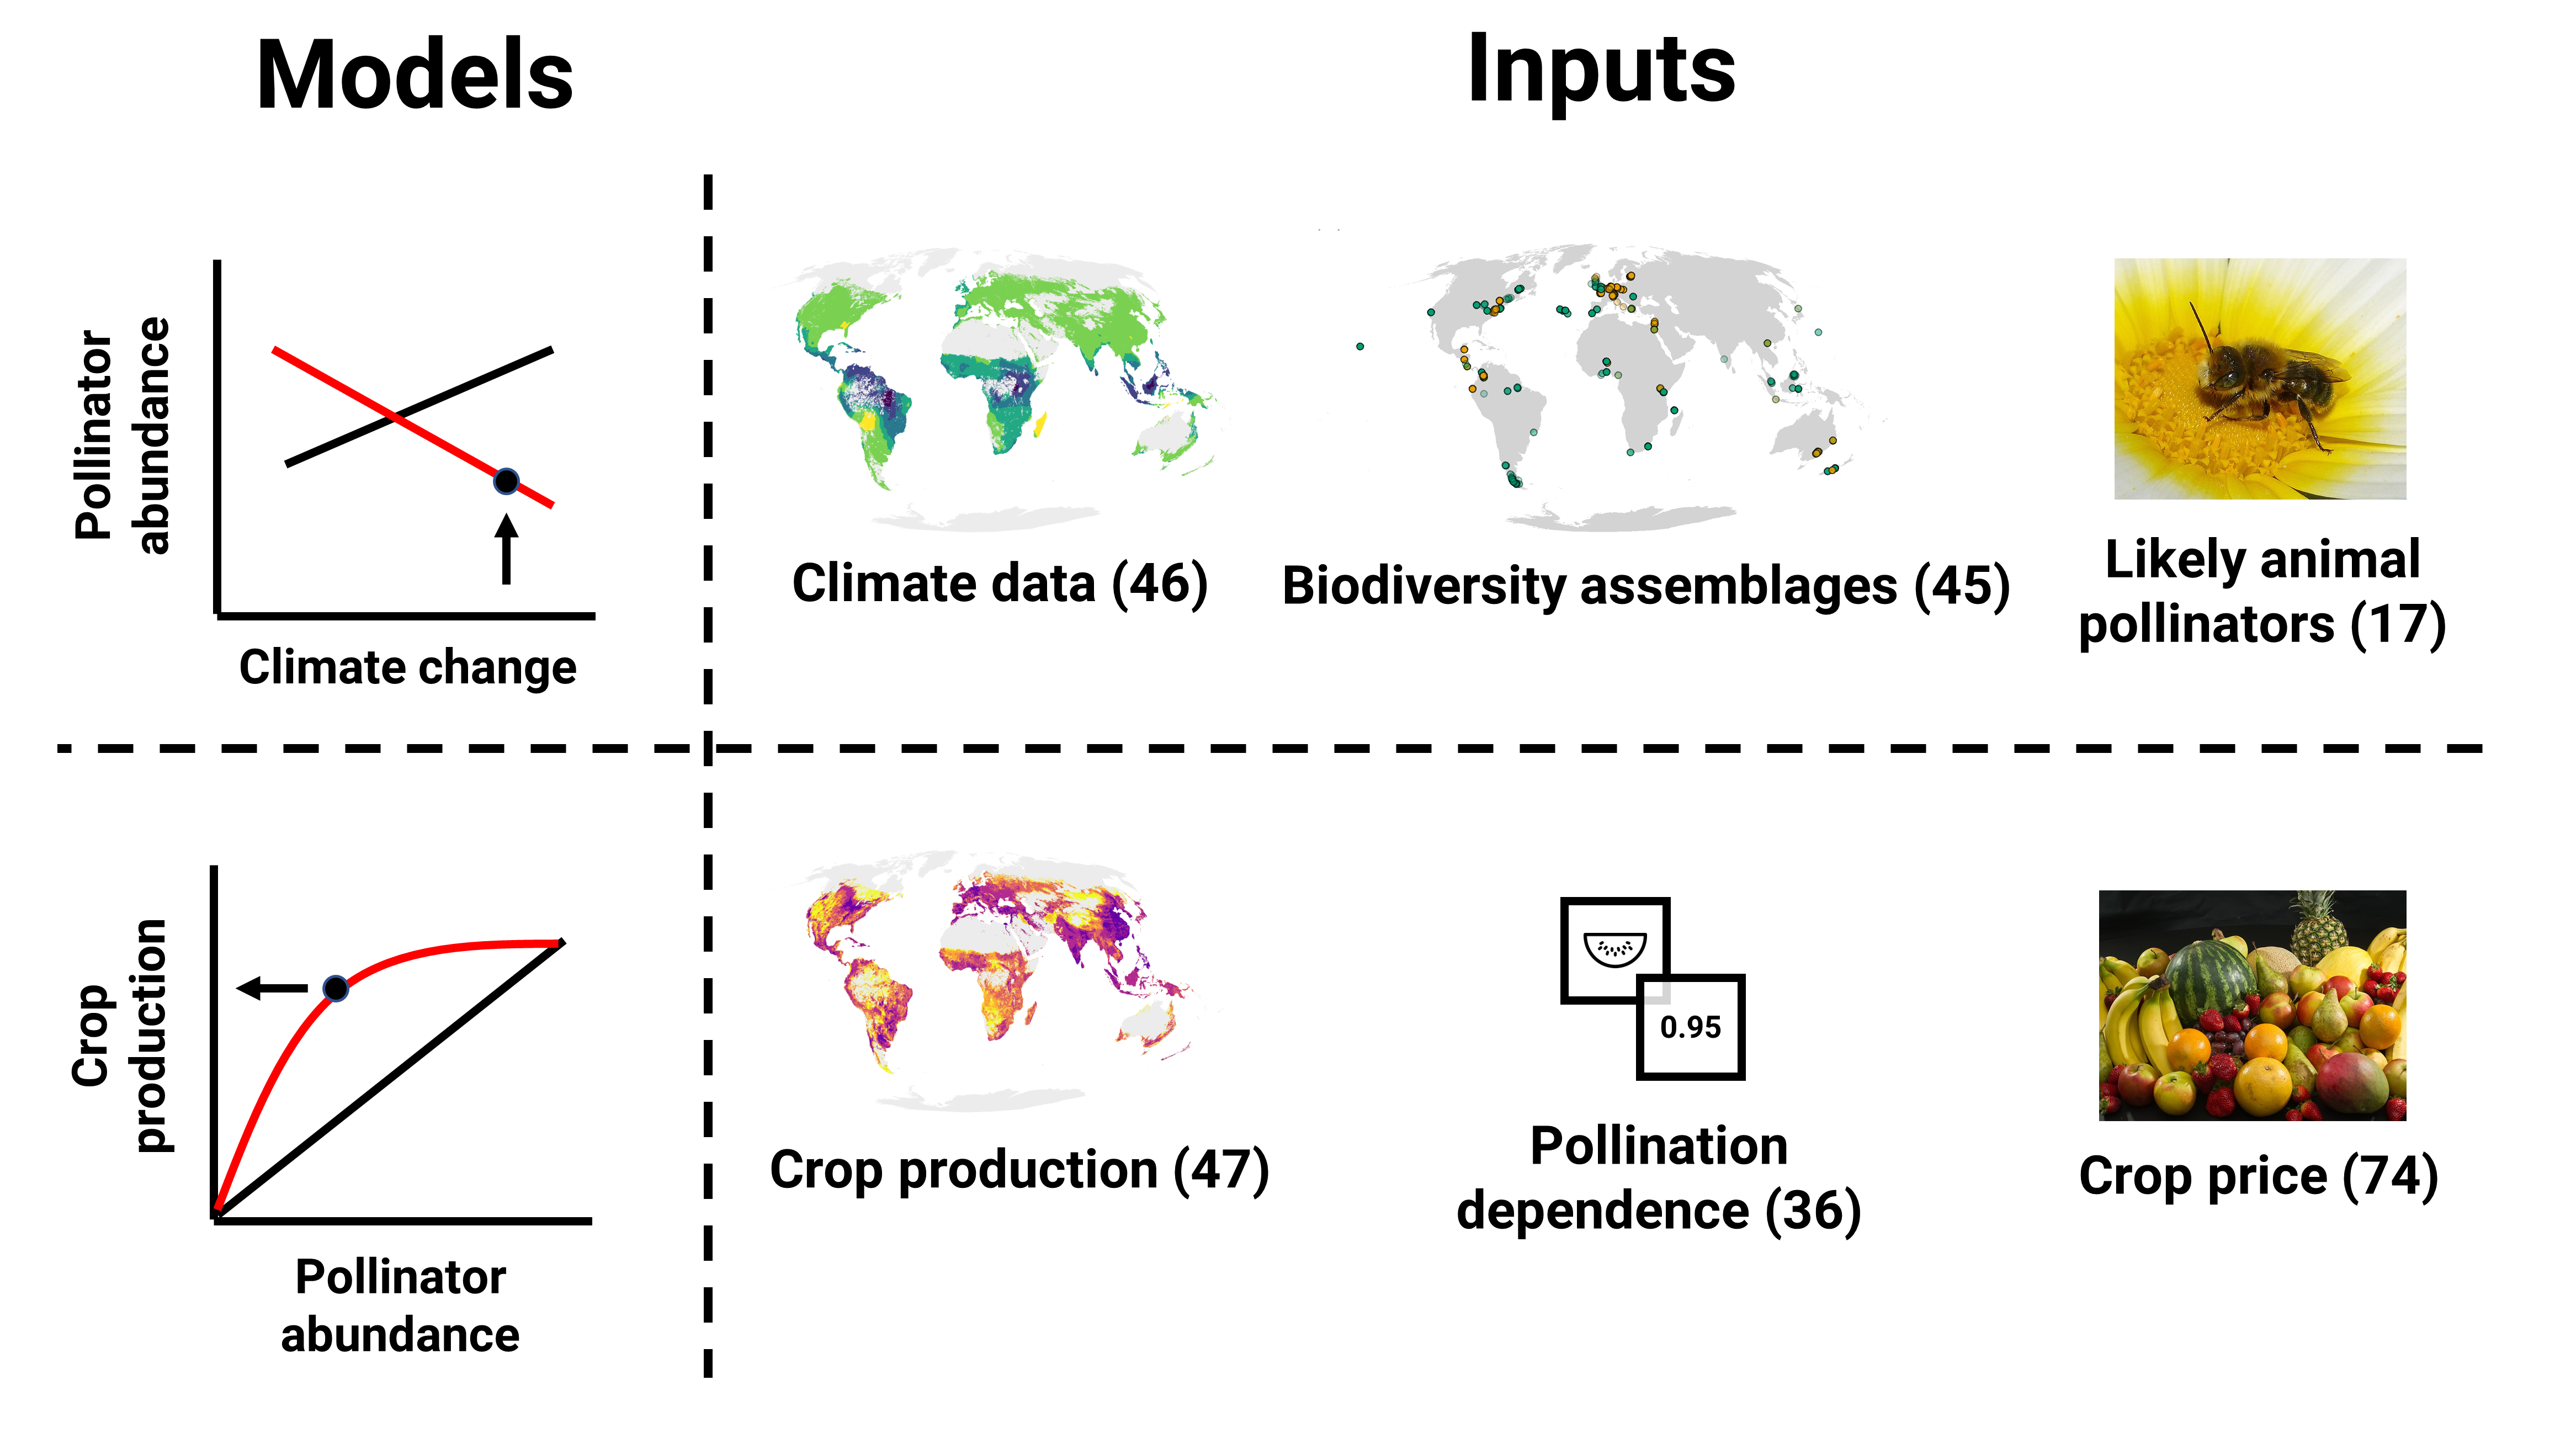
A) A schematic of models and inputs for our local production risk measure. (Top) The PREDICTS database (“Biodiversity assemblages,” subset for a set of “Likely animal pollinators”) is used to build a space-for-time model of pollinator biodiversity change, fitting total abundance as a function of an interaction between land use type and a standardized temperature anomaly of climate change (“Climate data” from the Climatic Research Unit). (Bottom) Change in insect pollinator abundance relative to a baseline (where standardized temperature anomaly is 0) is converted into a crop production loss via a set of linear functions and then converted into a pollination-dependent risk by multiplying the expected change by the pollination-dependent production in each cell (“Crop production” and “Pollination dependence”). Economic loss is calculated from production at risk multiplied by crop price. Numbers in brackets for each input represent the source from which the data originated (as listed in the bibliography). Image credits: Bottom right photo, Ionutzmovie (CC BY 3.0); top right photo, gailhampshire (CC BY 2.0). (reproduced from Millard et al. 2023)
Conservation culturomics
I’m also interested in the emerging field of conservation culturomics, or in other words using online data sources (i.e. Twitter, Facebook, Google Trends) to better understand human-nature interactions. In particular with colleagues at the Institute of Zoology, RSPB, and UCL I led the development of the Species Awareness Index (SAI), a new index of changing public biodiversity awareness derived from the rate of change in Wikipedia page views (Millard et al 2021a). We calculated this index for 41,197 IUCN species on Wikipedia, including over 2 billion views from the top 10 languages on Wikipedia (by active user).
Our work shows that awareness of biodiversity is likely marginally increasing, but that change in awareness differs markedly among taxonomic groups and languages. We also show that—over the period July 2015-July 2020—change in awareness is likely not related to either the trade of species or pollination contribution. Biodiversity value likely does relate to awareness, since traded species tend to get a higher number of total views, but our results would suggest that public awareness of the value of biodiversity is not continuing to increase.
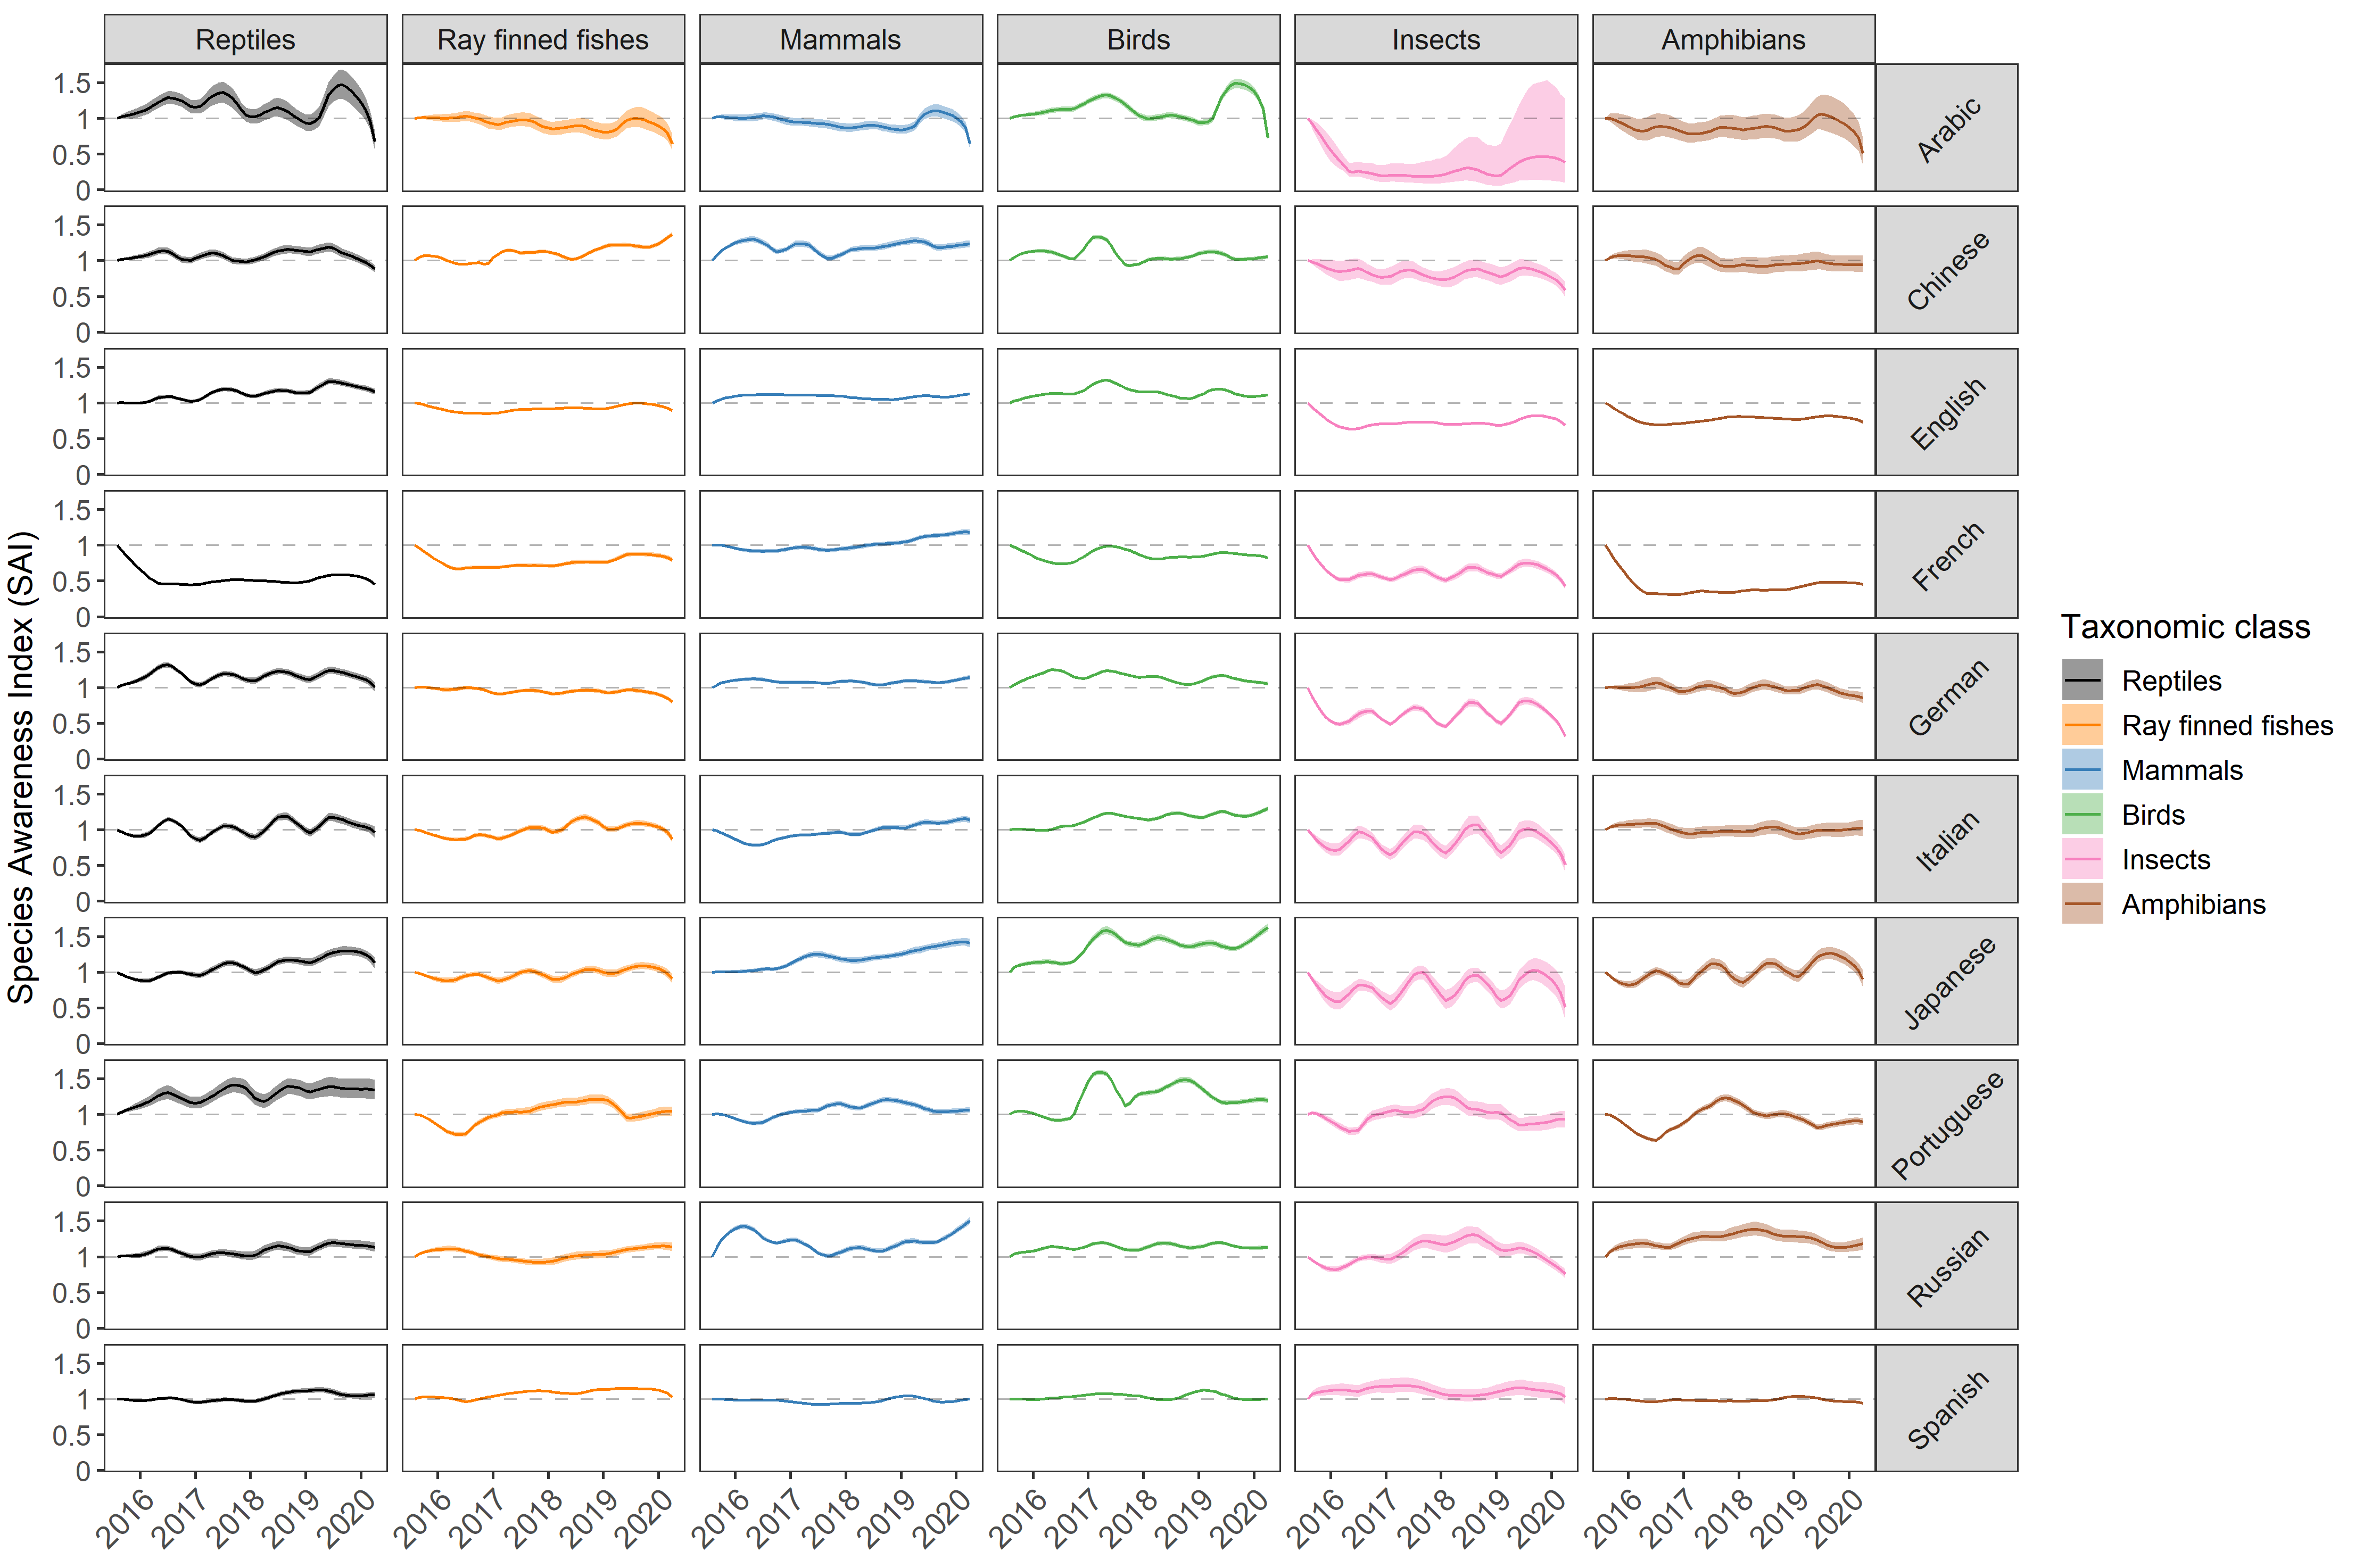
The Species Awareness Index (SAI) for 6 taxonomic classes (reptiles, ray-finned fishes, mammals, birds, insects, and amphibians) across 10 Wikipedia languages, for the period July 2015-March 2020. Coloured lines represent the mean of the bootstrapped indices at each monthly each time step, and coloured bands the 2.5th and 97.5th percentiles: reptiles (black), ray-finned fishes (orange), mammals (blue), birds (green), insects (pink), and amphibians (brown). Taxonomic class panels are ordered by the magnitude of overall increase in each taxonomic class, and for language alphabetically (reproduced from Millard et al. 2021a)
More recently I’ve overseen the development of a near real-time version of the Species Awareness Index, published in a new paper led by Tom Johnson with Richard Cornford, Shawn Dove, and Robin Freeman (Johnson et al 2023). In our paper we also set out a series of considerations for the development of real-time platforms for culturomics, and encourage that the field moves towards developing a real-time observatory that can evolve with the structure of the web.
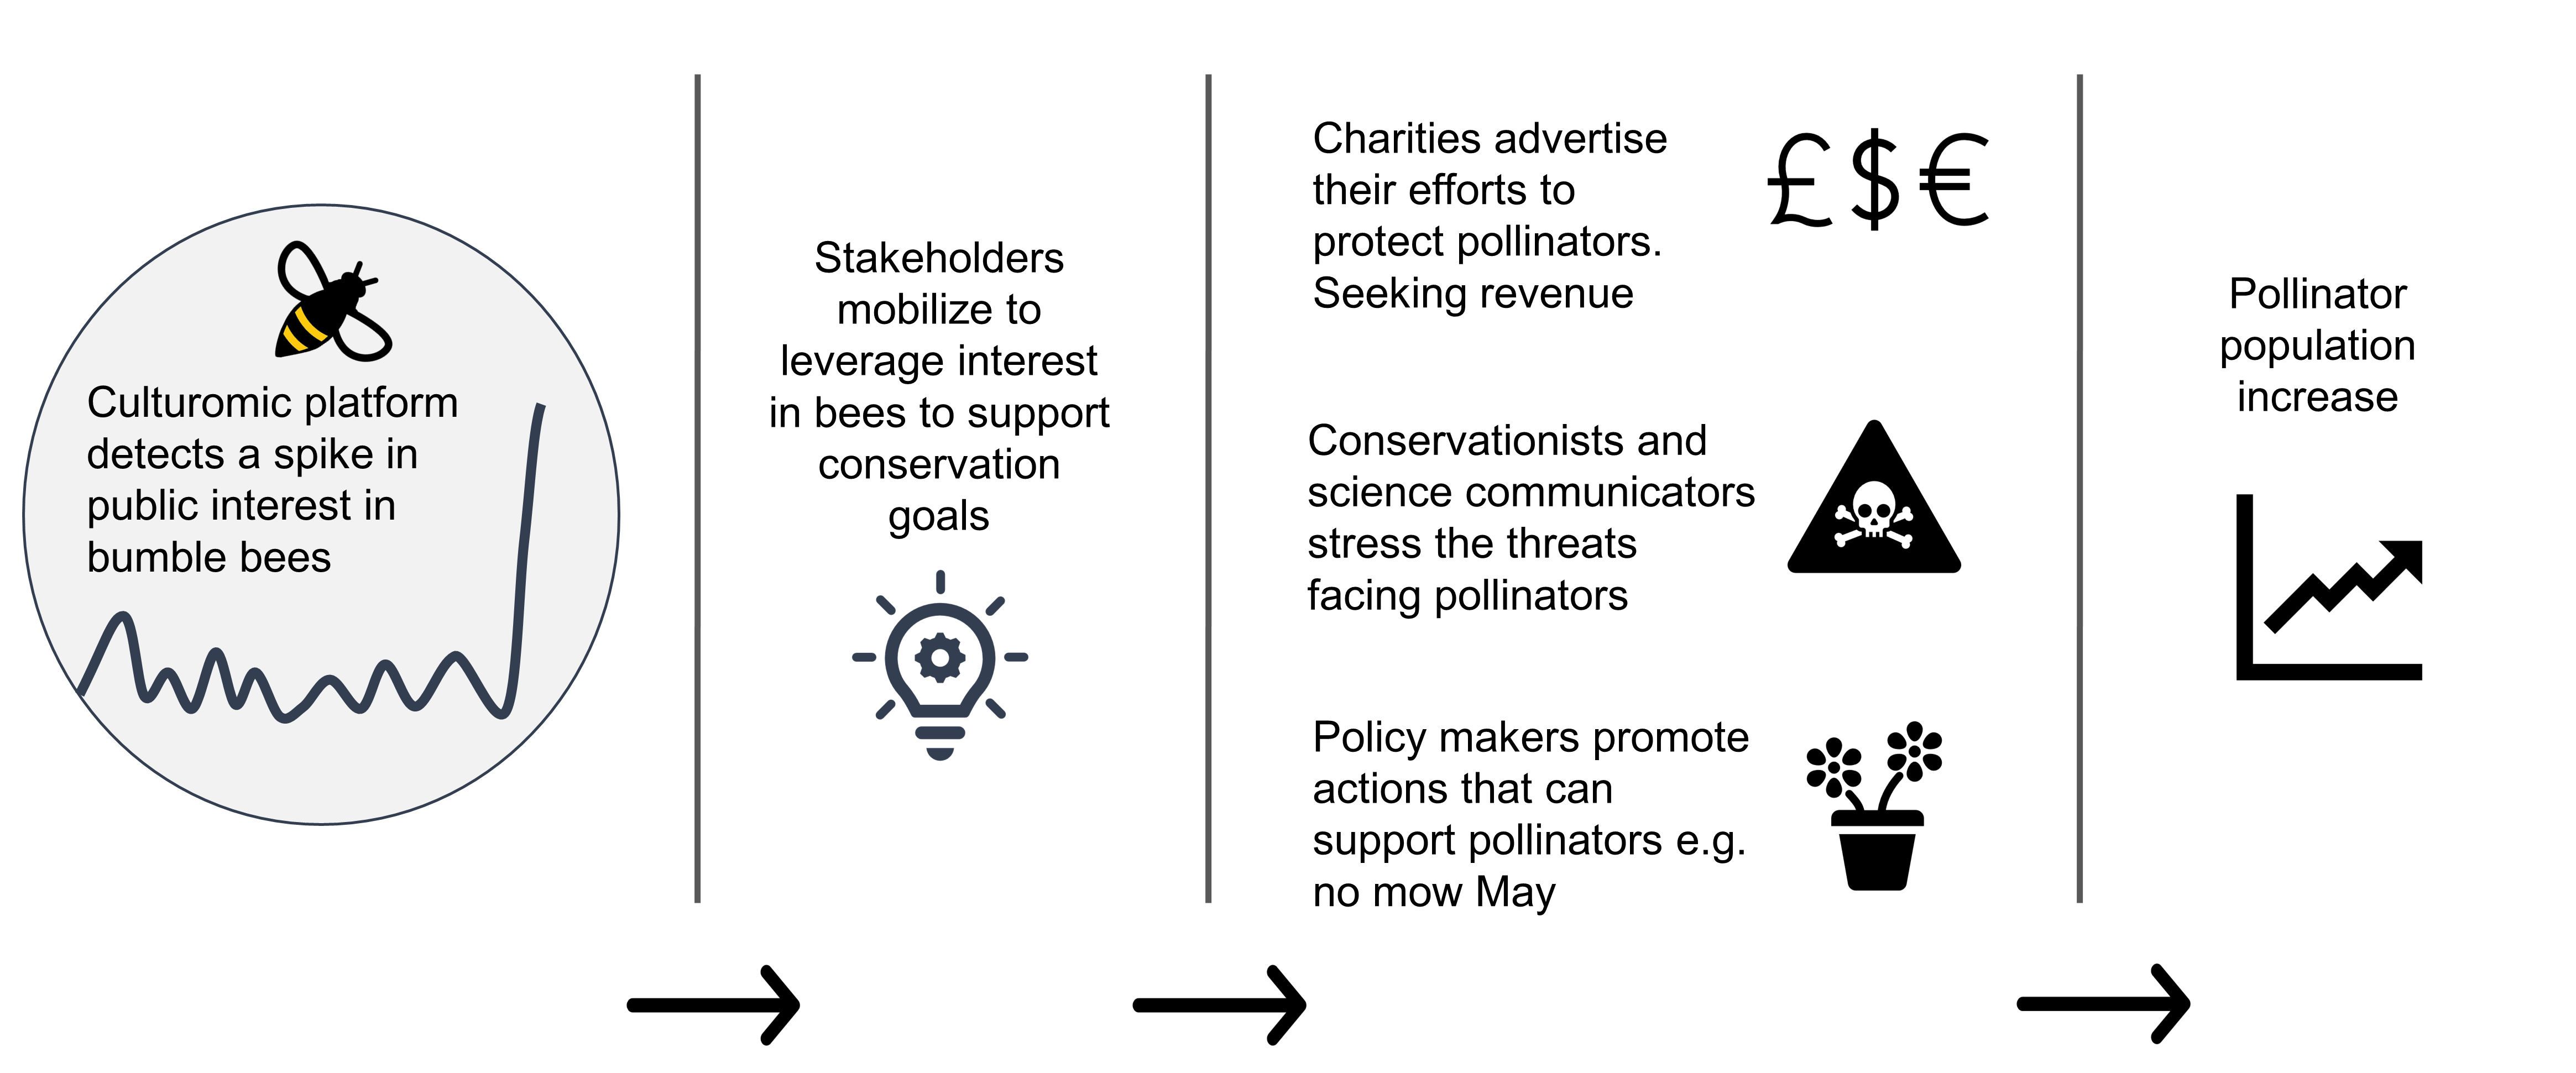
Potential application and impact of real-time culturomics, depicting how it could be possible to leverage spikes in interest to support conservation action. Under a non-real-time system, we may miss the spike in interest and fail to garner public support and action. Real-time monitoring of human-nature interactions could enable a reactive approach to conservation funding, that results in a more efficient use of resource. (reproduced from Johnson et al. 2023)
Informatics tools in ecology
I also have a much broader interest in informatics tools in ecology, such as text-mining, web-scraping, Shiny app development, dynamic meta-analyses, AI tools, and satellite telemetry analyses:
- As part of my PhD I used a set of name-entity recogntion tools (Taxize and CLIFF-CLAVIN) to explore the taxonomic and geographic distribution of the animal pollinator literature. As part of this research we showed that 25% of animal pollinator related abstracts mention a species of honeybee and 20% a species of bumblebee. We further confirmed that the geographic distribution of the animal pollinator literature (Millard et al 2020) is restricted to North America and Europe, although there is still a marked quantity of data outside these regions.
- More recently I’ve been collaborating with Tom Johnson, Richard Cornford, Manuella Gonzalez-Suarez, and Robin Freeman to further develop the capabilities of such automated research synthesis in ecology, leading to a publication led by Richard (Cornford et al 2022).
- I led Grace Skinner in the development of Dynameta, a new R package for dynamic meta-analyes in R Shiny (Skinner et al 2023).
- I’ve been collaborating with Daan Scheepens, Tim Newbold, and Robin Freeman on the use of ChatGPT for synthesis in ecology.
- I was involved in building an AI app for identifying plant species from photos, the result of which is now published as a freely available data set. The app would pull images of plants from Flickr (using photosearcher), predict what plant was in the image (using PlantNet), and then map each image onto geographical space (using R Shiny and leaflet).
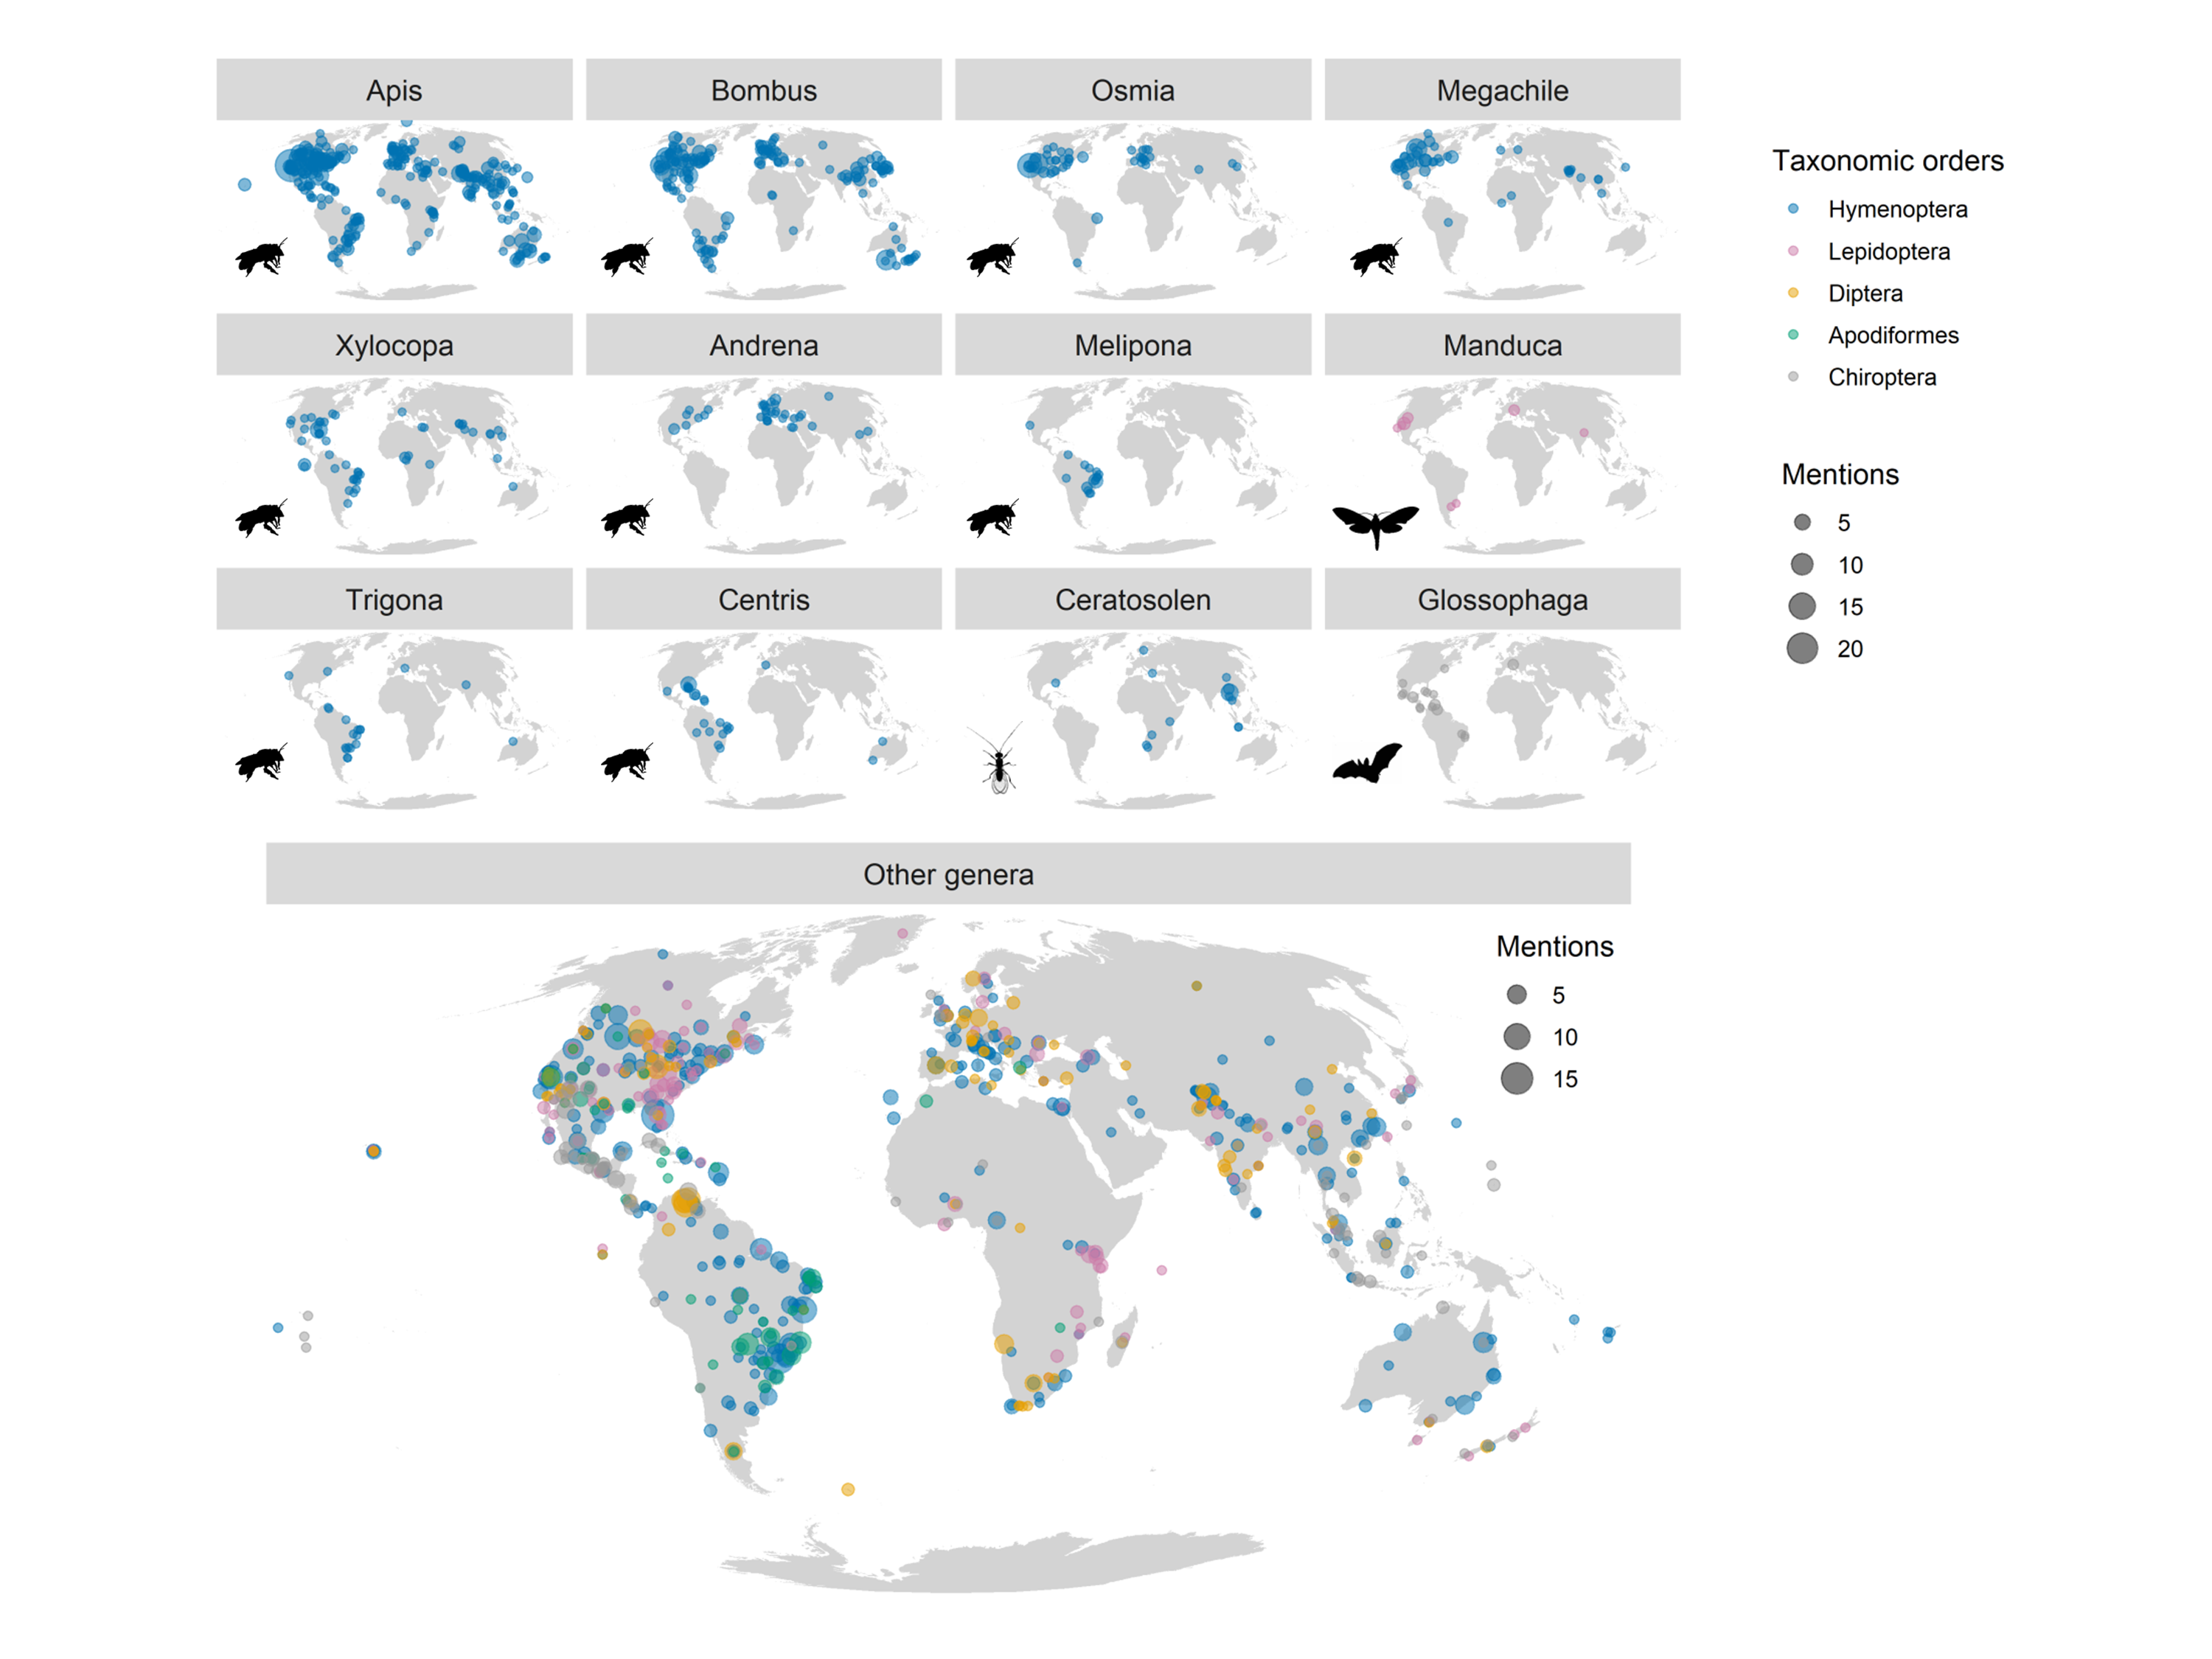
Distribution of the animal pollinator literature broken down into taxonomic groups, for the top 12 genera and top 5 orders. Taxonomic orders are indicated here by fill colour, consistent across top and bottom panels: Hymenoptera (blue), Lepidoptera (pink), Diptera (orange), Apodiformes (green) and Chiroptera (grey). Point size represents the frequency of unique abstract‐genera‐location combinations. ‘Other genera’ here consists of 1001 genera across the Hymentopera, Lepidoptera, Diptera, Apodiformes and Chiroptera. Given the inaccuracies inherent in CLIFF‐CLAVIN, and the problem in assuming all taxonomic names are associated with all locations in an abstract, these results should be interpreted with caution (reproduced from Millard et al. 2020)
References
Cornford, R., Millard, J., González‐Suárez, M., Freeman, R. and Johnson, T.F., (2022) Automated synthesis of biodiversity knowledge requires better tools and standardised research output. Ecography. DOI: https://doi.org/10.1111/ecog.06068
Hudson, L.N., Newbold, T., Contu, S., Hill, S.L., Lysenko, I., De Palma, A., Phillips, H.R., Alhusseini, T.I., Bedford, F.E., Bennett, D.J. and Booth, H., (2017). The database of the PREDICTS (projecting responses of ecological diversity in changing terrestrial systems) project. Ecology and evolution. DOI: https://doi.org/10.1002/ece3.2579
Johnson, T.F., Cornford, R., Dove, S., Freeman, R. and Millard, J., 2023. Achieving a real‐time online monitoring system for conservation culturomics. Conservation Biology. DOI: https://doi.org/10.1111/cobi.14096
Millard, J., Freeman, R. and Newbold, T., (2020). Text‐analysis reveals taxonomic and geographic disparities in animal pollination literature. Ecography. DOI: https://doi.org/10.1111/ecog.04532
Millard, J., Gregory, R.D., Jones, K. and Freeman, R., (2021a). The species awareness index as a conservation culturomics metric for public biodiversity awareness. Conservation Biology. DOI: https://doi.org/10.1111/cobi.13701. Selected to appear in an ‘Advancing Conservation Culturomics’ special section.
Millard, J., Outhwaite, C., Kinnersley, R., Freeman, R., Gregory, R.D., Adedoja, O., Gavini, S., Kioko, E.,Kuhlmann, M., Ollerton, J., Ren, Z-X., and Newbold, T., (2021b) Global effects of land-use intensity on local pollinator biodiversity. Nature Communications. DOI: https://doi.org/10.1038/s41467-021-23228-3
Millard, J., Outhwaite, C.L., Ceaușu, S., Carvalheiro, L.G., da Silva e Silva, F.D., Dicks, L.V., Ollerton, J. and Newbold, T., 2023. Key tropical crops at risk from pollinator loss due to climate change and land use. Science Advances. DOI: https://doi.org/10.1126/sciadv.adh0756
Skinner, G., Cooke, R., Keum, J., Purvis, A., Raw, C., Woodcock, B.A. and Millard, J., 2023. Dynameta: A dynamic platform for ecological meta-analyses in R Shiny. SoftwareX. DOI: https://doi.org/10.1016/j.softx.2023.101439